Introduction
This page will look at two main types of gaps in the provision of facilities for Ice Sports:
- Availability of accessible ice time (accessible here defined as within one hours drive or less)
- Type and quality of facility
Availability of Ice Time
UK Facility Proximity Map
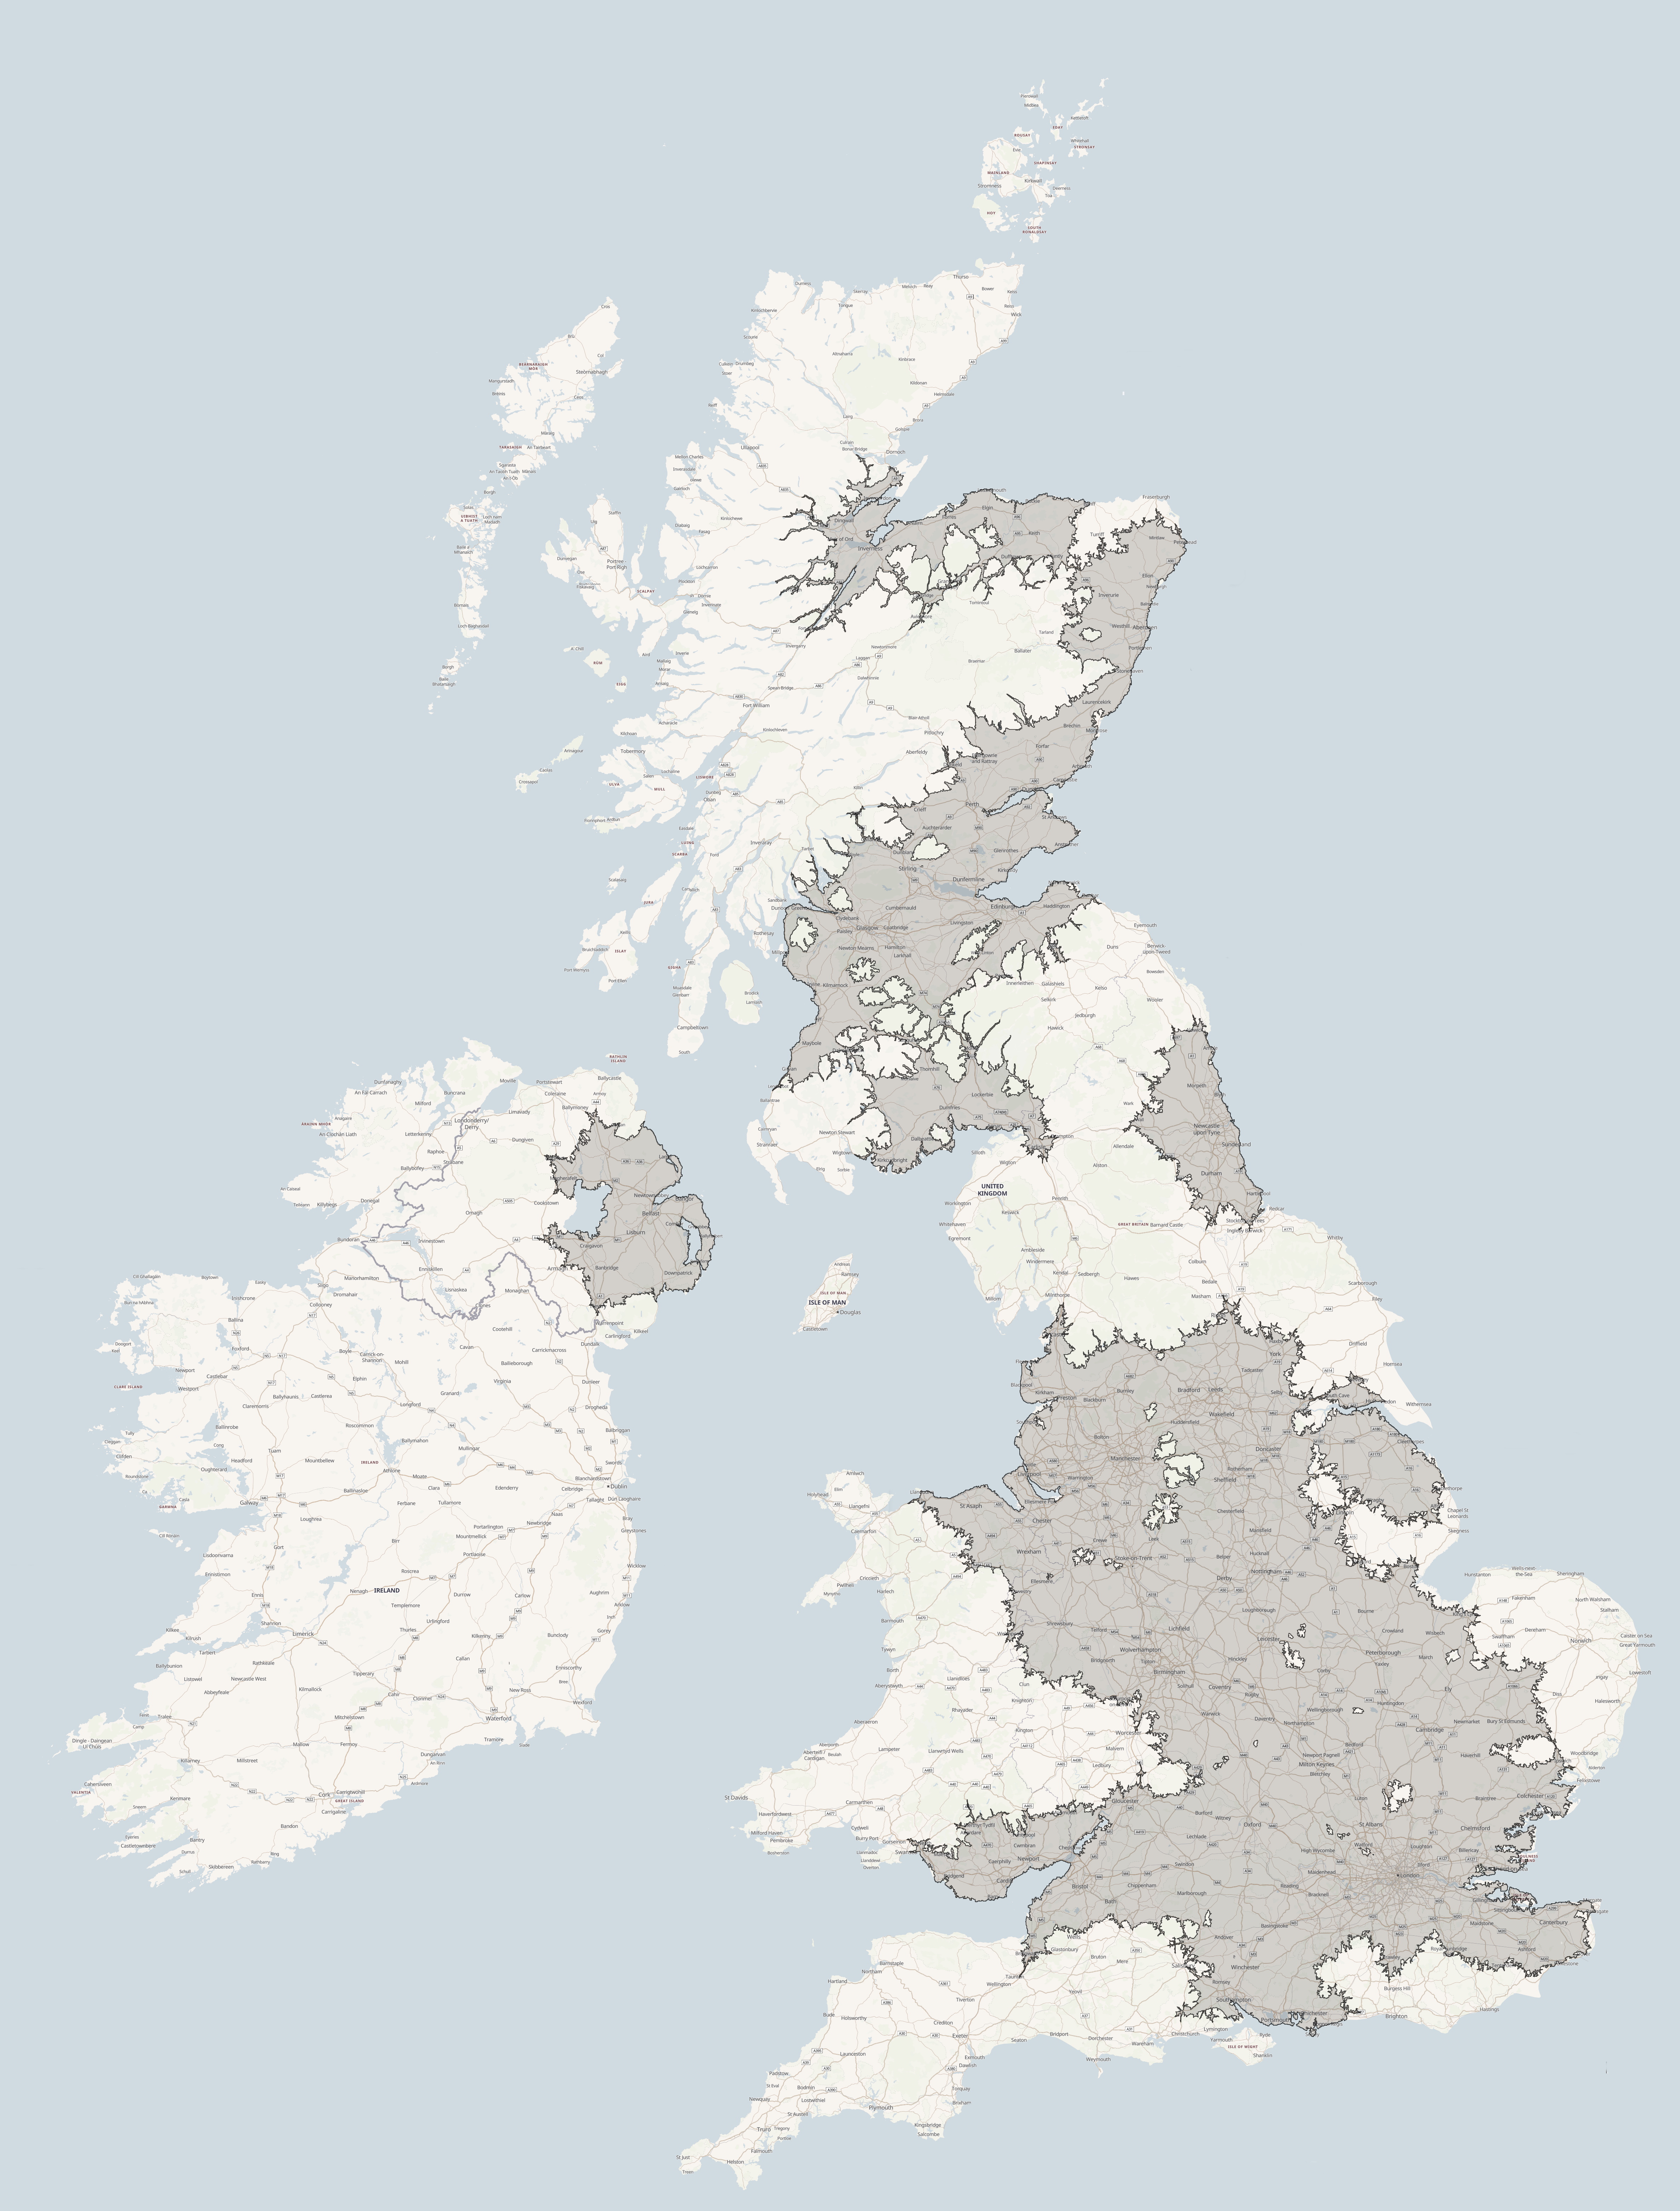
The map to the left of the page shows a shaded area of the UK which is within one hours drive of an existing ice rink. It makes no comment on the availability or quality of facilities.
There are a number of obvious gaps:
- South West England
- Wales
- South East Coast
- East Anglia
- Southern Lincolnshire
- Northern England
- Northern Ireland
- Republic of Ireland
Although the Republic of Ireland is not part of the UK, Irish skaters train, perform, and compete at UK Ice Rinks due to the lack of rinks in their country. Development of Irish rinks would foster competition and public interest in Ice Sports across both countries, therefore we fully support our Irish friends.
UK Towns and Cities with over 100k population
The table below shows UK Towns and Cities with a population of over one hundred thousand people at the time of the 2021 Census. This number was chosen as representative of the sort of area that supports existing rinks and sports facilities (e.g. Hemel Hempstead and Gillingham both have populations of just over 100k, and there are other locations with less population that have their own rinks).
| Name | Population (2021) | Own Rink | <1 Hour Drive | Notes |
|---|---|---|---|---|
| London | 8,888,608 | Y | Y | Multiple rinks in the city |
| Birmingham | 1,161,258 | N | Y | |
| Glasgow | 631,690 | Y | Y | |
| Bristol | 586,781 | Y | Y | |
| Liverpool | 576,561 | N | Y | |
| Manchester | 560,392 | Y | Y | |
| Sheffield | 525,142 | Y | Y | |
| Leeds | 515,947 | Y | Y | |
| Edinburgh | 505,310 | Y | Y | |
| Leicester | 487,837 | N | Y | |
| Bradford | 370,185 | Y | Y | |
| Coventry | 355,703 | Y | Y | |
| Cardiff | 349,780 | Y | Y | |
| Belfast | 340,000 | Y | Y | |
| Nottingham | 306,573 | Y | Y | |
| Kingston upon Hull (Hull) | 295,179 | Y | Y | |
| Newcastle (Newcastle upon Tyne) | 281,727 | N | Y | |
| Stoke-on-Trent | 279,769 | N | Y | |
| Derby | 269,053 | N | Y | |
| Southampton | 266,934 | N | Y | |
| Northampton | 245,899 | N | Y | |
| Reading | 242,572 | N | Y | |
| Portsmouth | 241,623 | N | Y | |
| Plymouth | 240,903 | N | N | |
| Luton | 233,498 | N | Y | |
| Brighton and Hove | 232,503 | N | N | |
| Wolverhampton | 218,488 | N | Y | |
| Bolton | 212,271 | N | Y | |
| Swindon | 201,669 | Y | Y | |
| Norwich | 200,996 | N | N | |
| Bournemouth | 200,916 | N | N | |
| Aberdeen | 196,220 | Y | Y | |
| Milton Keynes | 192,943 | Y | Y | |
| Peterborough | 189,561 | Y | Y | |
| Southend-on-Sea | 182,591 | N | Y | |
| Middlesbrough | 179,959 | N | Y | |
| Swansea | 178,118 | N | N | |
| Slough | 175,100 | Y | Y | |
| Warrington | 173,365 | N | Y | |
| Oxford | 172,264 | Y | Y | |
| Sunderland | 170,134 | N | Y | |
| Huddersfield | 167,534 | N | Y | |
| Cambridge (/ Milton) | 167,007 | Y | Y | |
| Poole | 160,778 | N | N | |
| York | 156,135 | N | Y | |
| Telford | 155,570 | Y | Y | |
| Ipswich | 151,240 | N | Y | Barely within 1 hour drive |
| Gloucester | 151,176 | N | Y | |
| Blackpool | 148,150 | Y | Y | |
| Watford | 148,069 | N | Y | |
| Dundee | 146,840 | Y | Y | |
| Birkenhead | 145,208 | N | Y | |
| Sale | 141,068 | N | Y | |
| Newport | 139,383 | N | Y | |
| Colchester | 138,753 | N | Y | |
| Salford | 129,794 | N | Y | |
| High Wycombe | 127,856 | N | Y | |
| Solihull | 126,245 | Y | Y | |
| Blackburn | 124,900 | Y | Y | |
| Exeter | 124,893 | N | N | |
| Maidstone | 121,723 | N | Y | |
| Chelmsford | 120,091 | Y | Y | |
| Cheltenham | 119,587 | N | Y | |
| Basingstoke | 118,807 | Y | Y | |
| Basildon | 117,341 | N | Y | |
| Crawley | 116,880 | N | Y | |
| Worthing | 116,192 | N | N | |
| Gateshead | 115,720 | N | Y | |
| Rochdale | 114,615 | N | Y | |
| Doncaster | 113,566 | N | Y | |
| Eastbourne | 113,127 | N | N | |
| Woking | 111,766 | N | Y | |
| Oldham | 111,321 | N | Y | |
| Lincoln | 111,201 | N | Y | Barely within 1 hour drive |
| Stockport | 111,023 | N | Y | |
| Sutton Coldfield | 109,899 | N | Y | |
| Wakefield | 109,766 | N | Y | |
| Rotherham | 109,697 | N | Y | |
| Gillingham | 107,897 | Y | Y | |
| St Helens | 106,591 | N | Y | |
| Wigan | 105,690 | N | Y | |
| Worcester | 105,491 | N | N | |
| Hemel Hempstead | 103,212 | Y | Y | |
| Bath | 101,557 | N | Y |
Ice Surfaces by Region
| Region | Number of Ice Pads | Population (m) | Ice Pads per Million | Variation from Mean | Rank |
|---|---|---|---|---|---|
| Scotland | 16 | 5.45 | 2.94 | 2.25 | 1 |
| West Midlands | 7 | 5.90 | 1.19 | 0.51 | 2 |
| Yorkshire & The Humber | 6 | 5.50 | 1.09 | 0.41 | 3 |
| South East | 8 | 9.10 | 0.88 | 0.20 | 4 |
| North East | 2 | 2.70 | 0.75 | 0.07 | 5 |
| London | 6 | 8.90 | 0.67 | -0.01 | 6 |
| Eastern | 4 | 6.20 | 0.65 | -0.03 | 7 |
| Wales | 2 | 3.14 | 0.64 | -0.05 | 8 |
| East Midlands | 3 | 4.80 | 0.62 | -0.06 | 9 |
| North West | 4 | 7.30 | 0.55 | -0.13 | 10 |
| Northern Ireland | 1 | 1.89 | 0.53 | -0.15 | 11 |
| South West | 2 | 5.60 | 0.36 | -0.32 | 12 |